
How to Identify and Trade Breakouts Like a Pro
Feb 12
/
LITFX ACADEMY
Breakout trading is one of the most exciting and profitable strategies in Forex trading. When executed correctly, it allows traders to capture strong price movements and ride trends early. However, many traders struggle with false breakouts, which can lead to unnecessary losses.
In this blog, we’ll cover:
• What breakouts are and why they happen.
• The different types of breakouts in Forex trading.
• How to confirm real breakouts and avoid fakeouts.
• The best breakout trading strategies.
• Risk management techniques to protect your capital.
By the end, you’ll have a solid understanding of how to trade breakouts like a pro and maximize your profits.
1. What is a Breakout in Forex?
A breakout occurs when the price moves beyond a key support or resistance level with strong momentum. This signals that buyers or sellers have gained control, pushing the price into a new territory.
Why Do Breakouts Happen?
Breakouts occur due to a combination of:
• Market sentiment – When traders react to economic news or fundamental shifts.
• Institutional orders – Large financial institutions execute buy/sell orders that drive prices.
• Technical patterns – Consolidation phases end, and price moves out of a range.
Confirmed vs. False Breakouts:
• Confirmed Breakouts: The price moves beyond a key level and sustains momentum.
• False Breakouts (Fakeouts): The price appears to break out but quickly reverses back into the range, trapping traders.
Many fakeouts happen because traders misidentify key support and resistance zones. Before executing breakout trades, it’s crucial to recognize the strongest levels. Learn how to identify and use key levels effectively in our guide on:
Support and Resistance
2. Types of Breakouts Every Trader Should Know
A. Trend Breakouts
• These occur when price breaks a major trendline, signaling a possible trend reversal or continuation.
• Example: In an uptrend, price consistently makes higher highs and higher lows. A breakout above a resistance zone suggests trend continuation, while a breakdown below support signals a potential reversal.
For example:
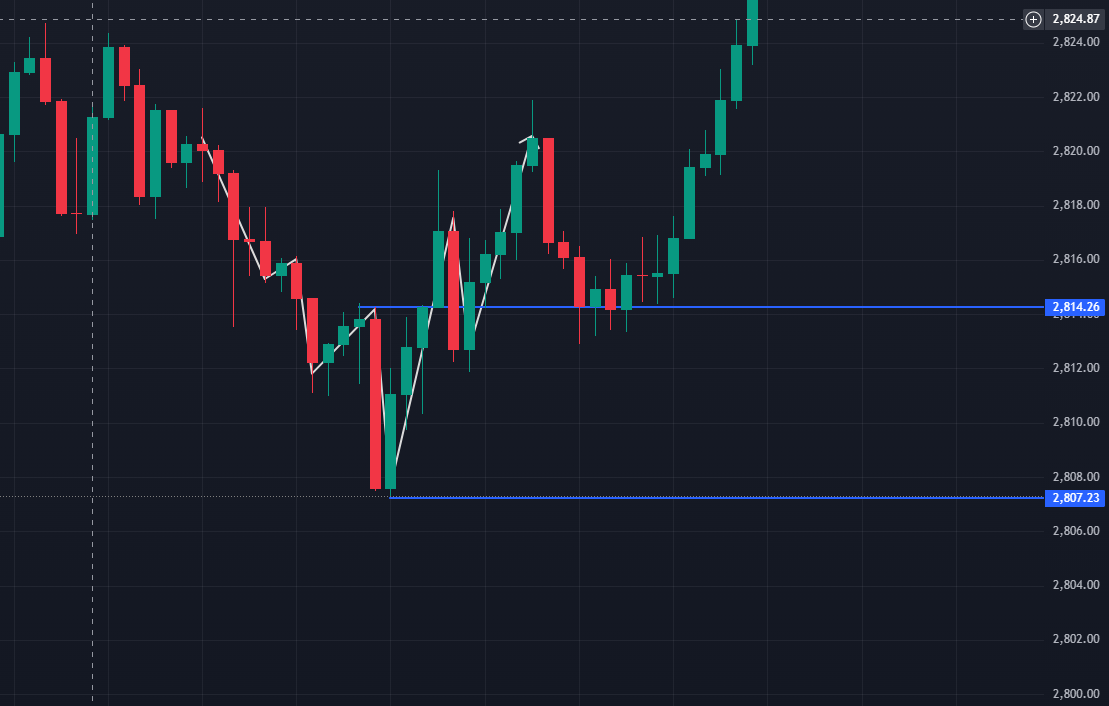
1. Pre-Breakout Price Action
• The price was initially in a downtrend, forming lower highs and lower lows.
• The 2,807.23 level acted as strong support, where price found buyers and reversed upward.
• Price tested 2,814.26 multiple times but failed to break above it immediately.
• The price was initially in a downtrend, forming lower highs and lower lows.
• The 2,807.23 level acted as strong support, where price found buyers and reversed upward.
• Price tested 2,814.26 multiple times but failed to break above it immediately.
2. Breakout Confirmation
• Eventually, price broke above 2,814.26 with a strong bullish candle, showing momentum and buyer strength.
• This breakout candle closed well above the resistance level, increasing the likelihood of a valid breakout instead of a fakeout.
• Volume confirmation (not shown) would further validate the move.
3. Retest and Continuation
• After the breakout, price retested the 2,814.26 level, turning it into new support.
• The retest was successful as buyers stepped in, leading to a strong bullish rally.
• The price then surged to 2,824.87, confirming the breakout’s strength.
• After the breakout, price retested the 2,814.26 level, turning it into new support.
• The retest was successful as buyers stepped in, leading to a strong bullish rally.
• The price then surged to 2,824.87, confirming the breakout’s strength.
4. Trading Strategy Based on This Breakout
- Aggressive Entry: Traders could enter immediately after the breakout above 2,814.26, placing a stop-loss below this level (around 2,810).
- Retest Entry (Safer Approach): More conservative traders could wait for price to retest 2,814.26, confirming it as support before entering long.
- Target Levels: Initial take-profit could be 2,824.87 (next resistance), with further targets based on trend momentum. and multi-timeframe
B. Range Breakouts
• Price moves within a sideways range, bouncing between support and resistance.
• When price breaks out of the range, it often leads to a strong move in the breakout direction.
• Ideal for traders looking for high volatility moves after consolidation.
For example:
• When price breaks out of the range, it often leads to a strong move in the breakout direction.
• Ideal for traders looking for high volatility moves after consolidation.
For example:
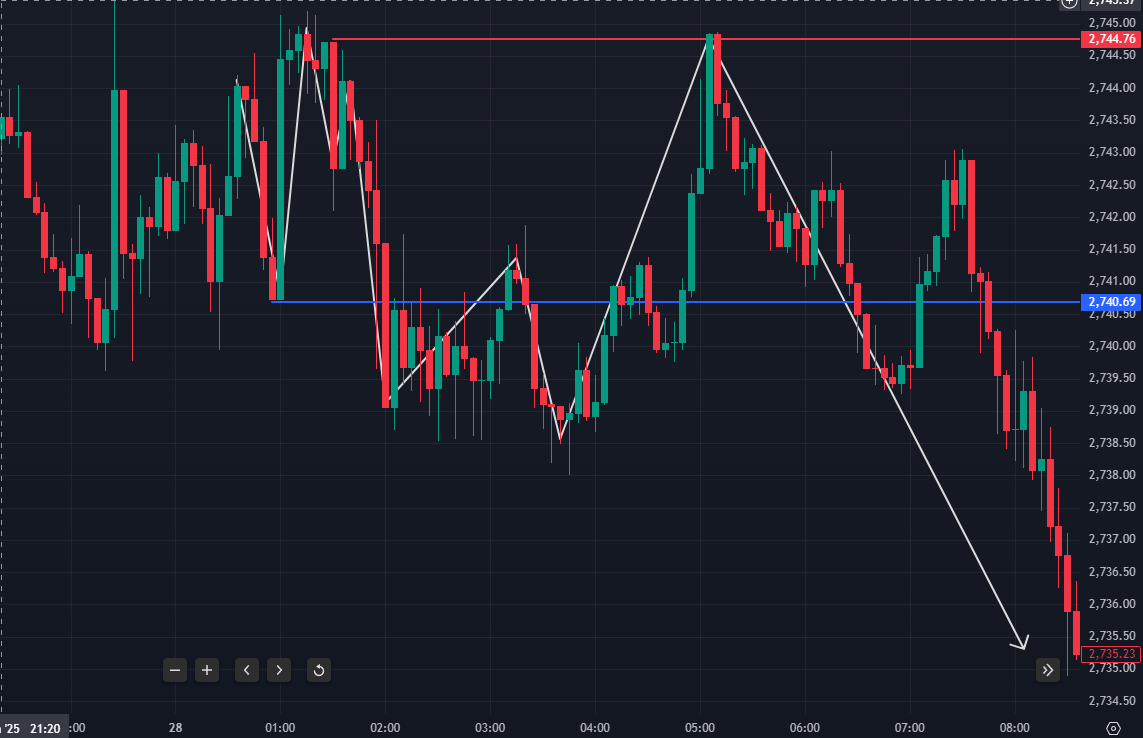
in this chart, we see a classic range breakout where the price initially traded within a consolidation zone before breaking lower. Let’s analyze the key levels and price movements.
1. Key Levels & Initial Range
• Blue Line (2,740.69) → Previous Support Level
• The price tested this level multiple times before finally breaking below it.
• Red Line (2,744.76) → New Resistance Level (Multi-Timeframe Confirmation)
• This level was identified using a higher timeframe, confirming strong resistance after the breakdown.
2. Breakdown of the Support Level (Blue Line: 2,740.69)
• The price was ranging within this support & resistance zone before eventually breaking below 2,740.69.
• The breakdown occurred with strong bearish momentum, confirming that sellers took control.
• After the breakout, price attempted to retest 2,740.69, which now acted as resistance (support turned resistance).
3. Confirmation of a Strong Downtrend
• Retest and Rejection: After breaking below 2,740.69, the price retraced to test this level but was rejected, confirming it as a new resistance.
• Downward Continuation: Once sellers confirmed their dominance, price dropped sharply towards the 2,735.23 level, making a new low.
• Multi-Timeframe Validation: The resistance at 2,744.76 from a higher timeframe confirmed the bearish bias, making the breakdown more reliable.
C. False Breakouts (Fakeouts)
• Price briefly moves past a key level but then reverses sharply.
• Market makers often trigger stop-losses of retail traders before reversing price in the opposite direction.
• Traders must confirm breakouts before entering trades to avoid being trapped.
For example:
• Market makers often trigger stop-losses of retail traders before reversing price in the opposite direction.
• Traders must confirm breakouts before entering trades to avoid being trapped.
For example:
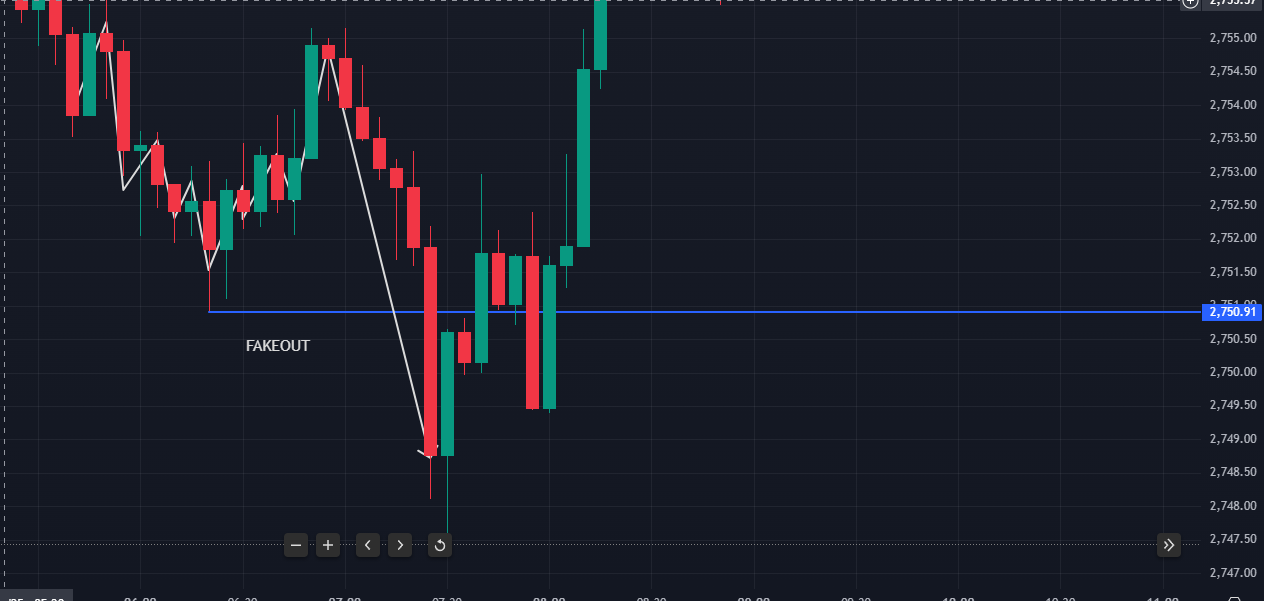
In this chart, we see a fakeout breakout where the price initially closed below the 2,750.91 support level, giving a false confirmation of a breakdown before reversing back above it. This happened due to the presence of strong external support on a higher timeframe (HTF).
1. Initial Breakout & Fake Confirmation
• The price broke below 2,750.91, closing a bearish candle under the level.
• This would typically be seen as a confirmation of a valid breakdown for traders using only this timeframe.
• However, higher timeframe (HTF) support provided strong buying pressure, leading to a reversal.
2. External Support from HTF Triggers a Reversal
• While lower timeframe traders saw a confirmed breakout, HTF traders recognized that a major support zone existed just below the breakout.
• Banks and institutions used this level to trap breakout sellers and push the price back up.
• The market reversed aggressively, reclaiming 2,750.91, confirming the fakeout.
3. How to Avoid Fakeouts Like This
- Multi-Timeframe Analysis: Always check HTF support & resistance before taking breakout trades.
- Wait for Retest Confirmation: Instead of entering immediately after a breakout, wait for price to retest and hold below the broken level.
- Monitor Volume: Real breakouts often have high volume, while fakeouts may show low momentum before reversing.
- Use Stop-Loss Properly: Place stops strategically (above/below external HTF levels) to avoid getting trapped in fakeouts.
4. Trading Strategy for Fakeout Breakouts
• If you entered a sell trade after the breakdown of 2,750.91, you would have been caught in the trap.
• A better approach would be to wait for a retest of 2,750.91 and check if price holds below it before shorting.
• Once price reclaimed the level, a bullish reversal trade could have been taken, targeting the next resistance zone.
5. Key Takeaways
• Fakeouts often happen near HTF support or resistance levels.
• Breakout confirmation on a lower timeframe doesn’t always mean continuation.
• Patience is key—waiting for proper retests or HTF confluence helps avoid false breakouts.
3. How to Confirm a Breakout (Avoiding Fakeouts!)
1. Volume Analysis
• A real breakout typically occurs with high trading volume.
• If volume is low, the breakout is more likely to be a fakeout.
2. Candlestick Confirmation
• Wait for a strong candle close beyond the breakout level.
• Avoid entering based on small wicks or weak breakouts.
3. Retest Strategy
• After breaking a level, price often comes back to retest it before continuing.
• Waiting for this retest increases the probability of success.
4. Multi-timeframe
• Always Monitor HTF key level areas where price can potentially react from
4. Risk Management for Breakout Trading
1. Always Use a Stop-Loss
• Common stop-loss levels: 10-30 pips away from the breakout point.
• Adjust based on volatility and risk tolerance.
2. Use a Risk-to-Reward Ratio
• Aim for at least 1:2 or 1:3 reward-to-risk ratio.
• This ensures long-term profitability even with some losing trades.
3. Avoid Trading Low-Volume Breakouts
• Fakeouts are common when breakout volume is low.
• Always check multi-timeframes key levels before entering.
Conclusion
Breakout trading is a powerful strategy when executed correctly. However, traders must identify real breakouts, avoid fakeouts, and use proper risk management to succeed.
Key Takeaways:
• Always wait for confirmation before entering a breakout trade.
• Use volume, candlestick patterns, and indicators to validate breakouts.
• Choose the right strategy: Aggressive, Retest, or Fakeout.
• Apply stop-losses and risk-to-reward ratios to protect capital.
Before trading live, test these strategies on a demo account to refine your skills. With practice and patience, you can trade breakouts like a pro and boost your Forex profitability!
''Success in trading isn’t about quick wins—it’s about mastering your craft, staying disciplined, and pushing through challenges when the market tests you. The traders who succeed aren’t the ones who never lose, but the ones who never quit. Keep refining your strategy, trust the process, and stay committed to growth''
Join today to elevate your game, sharpen your skills, and take your trading to the next level! Your breakthrough is waiting—go claim it!

LITFX Academy is the ultimate trading education platform, helping traders master Support & Resistance, refine risk management, and build confidence in the markets. Learn from real-world strategies, live coaching, and a thriving community of traders just like you!
Disclaimer: The content provided by LITFX Academy is for educational and informational purposes only. It does not constitute financial, investment, or trading advice. Trading involves risk, and past performance is not indicative of future results. Always do your own research and consult with a licensed financial professional before making any financial decisions.
Disclaimer: The content provided by LITFX Academy is for educational and informational purposes only. It does not constitute financial, investment, or trading advice. Trading involves risk, and past performance is not indicative of future results. Always do your own research and consult with a licensed financial professional before making any financial decisions.
© 2025 LITFX Academy. All Rights Reserved.