Mastering Support and Resistance: A Trader’s Guide to Key Levels
Feb 3
/
LITFX ACADEMY
Support and resistance levels are often called the building blocks of technical analysis. Whether you’re a beginner or a seasoned trader, mastering these key levels is essential for making informed trading decisions.
Many traders struggle to identify these levels effectively or use them incorrectly, leading to missed opportunities or unnecessary losses. But here’s the good news: once you understand how to spot and trade these levels, you’ll gain a significant edge in the market.
In this guide, we’ll break down the basics, show you how to identify strong levels, and share actionable strategies you can apply immediately.
At its core:
• Support is a price level where buying pressure is strong enough to prevent the price from falling further. Think of it as the “floor” where prices bounce back up.
• Resistance is a price level where selling pressure is strong enough to prevent the price from rising further. It acts as a “ceiling” that prices struggle to break through.
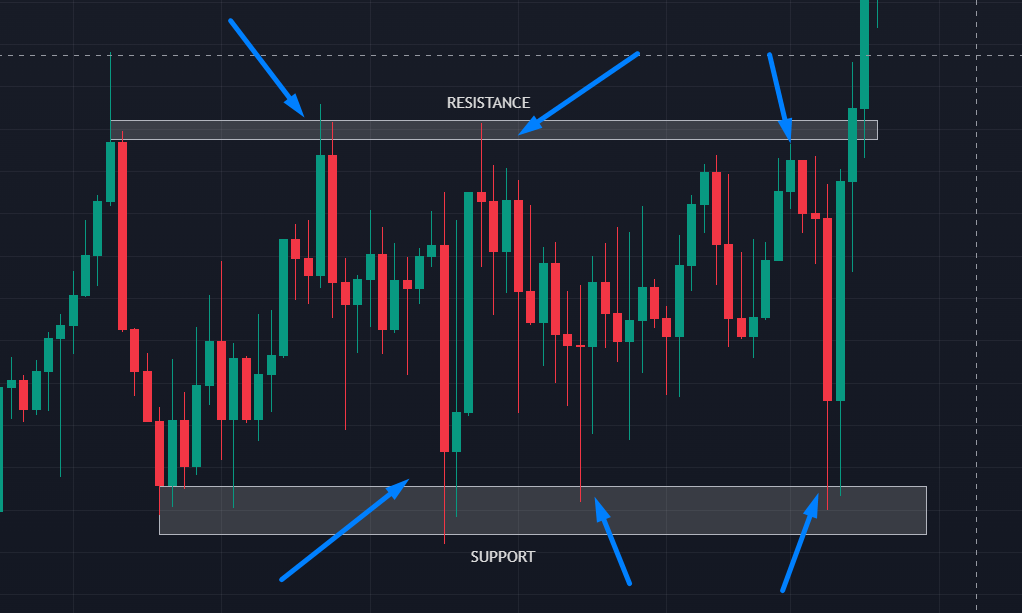
1. Support (Highlighted Area at the Bottom):
• The shaded area at the bottom represents support, where the price has repeatedly bounced back up after testing it.
• Why it’s important: This level shows strong buying interest, where buyers step in to prevent the price from falling further.
Key Observations:
• Notice how the price touched this area multiple times and reversed upward.
• This makes it a reliable level to place buy trades or set stop-losses below the support zone.
2. Resistance (Highlighted Area at the Top):
• The shaded area at the top represents resistance, where the price struggles to break above.
• Why it’s important: This level shows strong selling interest, where sellers prevent the price from rising further.
Key Observations:
• Notice how the price reversed downward each time it approached this zone.
• Traders can place sell trades near this resistance or set stop-losses above it.
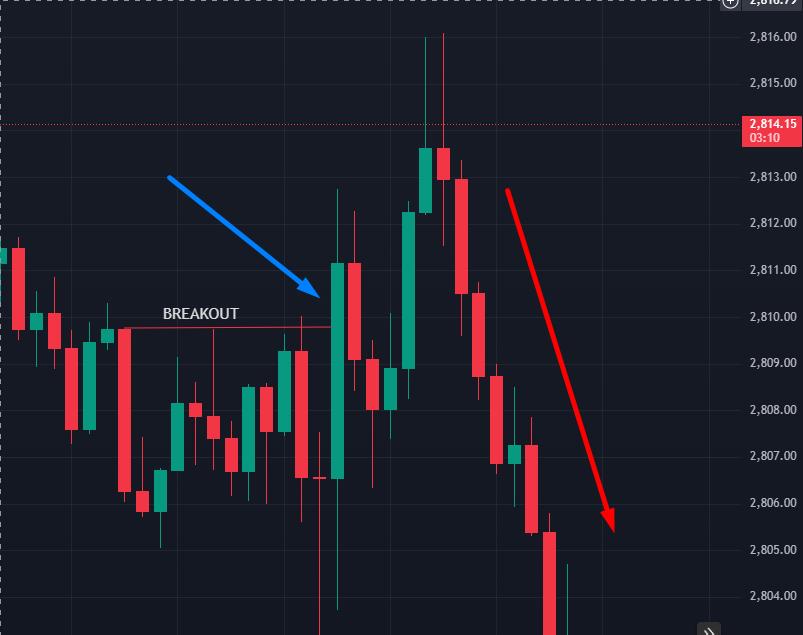
3. Breakout (Right Side of the Chart):
• The price eventually broke above the resistance level, indicating strong buying momentum.
What happens next:
• The last bearish candle that caused the breakout will be your support.
• Wait for a potential retest of this level before entering a buy trade to confirm the breakout.
Support and resistance levels are more than just lines on a chart—they’re key decision points for traders. Here’s why they matter:
• Optimal Entry and Exit Points: You can time your trades better by buying near support and selling near resistance.
• Market Psychology: These levels reflect where traders historically placed buy and sell orders.
• Risk Management: They help you set stop-loss and take-profit levels strategically, minimizing risks.
FOR EXAMPLE
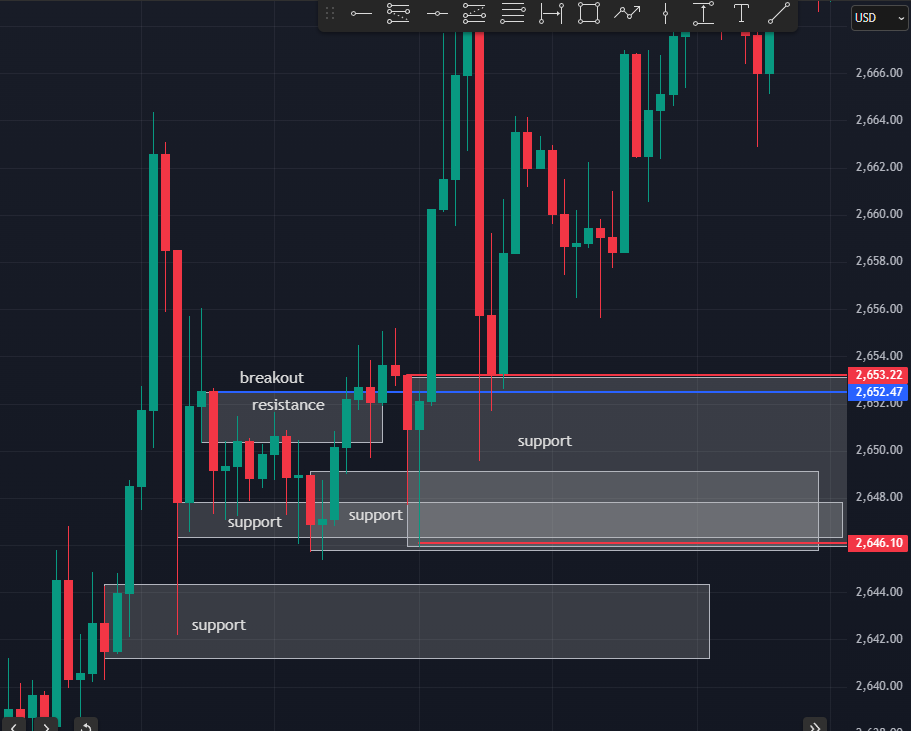
1. Support Levels (Red Lines):
• The red lines represent support zones where the price repeatedly bounced back up after touching these levels.
• These support levels acted as a “floor” for the price, preventing further declines.
Examples from the Chart:
• The lower red line (around 2,646) was tested multiple times, showing strong buyer interest.
• The higher red line (just below 2,652) temporarily acted as support before the breakout occurred.
2. Resistance Level (Blue Line):
• The blue line represents the resistance zone where the price struggled to break through.
• Resistance acts as a “ceiling,” where selling pressure is high, preventing the price from rising further.
Example from the Chart:
• The resistance was repeatedly tested before the price finally broke above it.
3. Breakout of Resistance:
• After multiple attempts, the price broke above the blue resistance line, showing strong buying momentum.
• This breakout indicated a potential shift in market sentiment, turning resistance into support.
4. Retest After Breakout:
• After the breakout, the price retraced downward to retest the low that caused the breakout of the resistance.
• This retest confirms the breakout’s validity, as buyers regained control near the support level and pushed the price higher again.
Example from the Chart:
• The price returned to the area around the red support line (just below 2,652), validating it as a strong level for a bullish continuation.
Finding the right levels takes practice. Here are the most effective methods:
Historical Price Levels:
• Look at past charts to find areas where the price repeatedly reversed. These zones are likely to act as strong support or resistance in the future.
Round Numbers:
• Levels like 1.0000, 1.2000, or 1.5000 are psychologically significant. Traders often place orders around these numbers, making them key zones.
Swing Highs and Lows:
• Identify the recent peaks and valleys on the chart. These are often critical levels where the price may react.
Use Multiple Timeframes:
• Combine daily, 4-hour, and 1-hour charts to spot key levels with high accuracy. Larger timeframes often reveal stronger support and resistance zones.
Once you’ve identified strong levels, here’s how you can trade them:
A. Bounce Strategy
• Wait for the price to hit a support or resistance level.
• Look for confirmation signals like candlestick patterns (e.g., pin bars, engulfing patterns).
• Enter your trade in the direction of the bounce.
Overloading Your Chart:
• Avoid marking every small movement as support or resistance. Focus on significant levels that have been tested multiple times.
Falling for False Breakouts:
• Not every breakout is real. Wait for confirmation before entering a trade.
• Always trade in the direction of the overall market trend to increase your chances of success.
• Use Price Action: Pay attention to candlestick patterns and how price interacts with key levels before a breakout. Learn more about
Breakouts Strategy
• Keep Practicing: Use a demo account to refine your skills without risking real money.
• Track News Events: Major news (like NFP or central bank announcements) can influence whether support or resistance holds or breaks
Support and resistance levels are essential tools for traders at any level. By mastering these levels, you’ll not only improve your entries and exits but also gain a deeper understanding of market dynamics.
Start small, practice identifying these levels, and incorporate them into your trading strategy. The journey to becoming a better trader begins here.
Trading doesn’t have to be a solo journey.
Join our community of passionate traders, share ideas, and learn together. Start mastering the markets today!